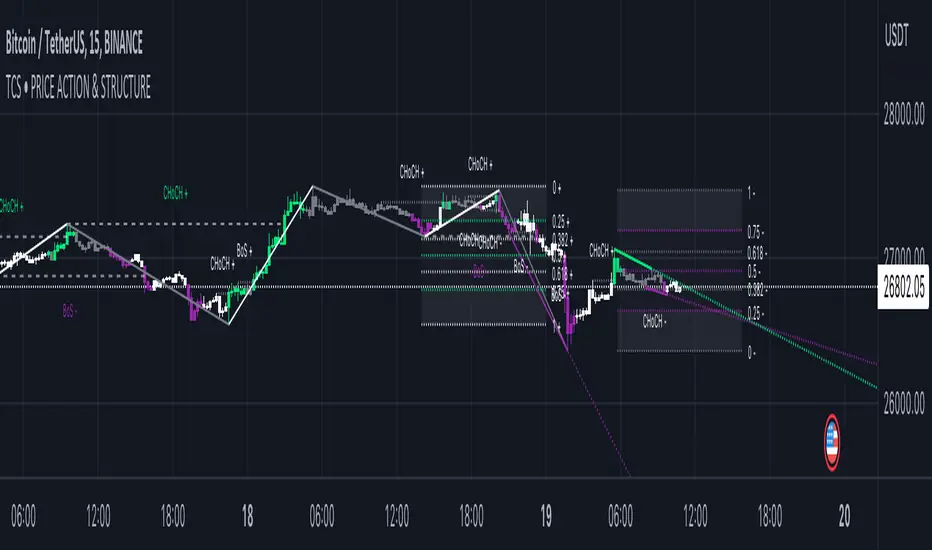
Price Action and market structure [Tcs] | PAThis indicator shows in real time the clearest and most complete vision of the price market structure, without considering volumes.
It has been developed mainly to identify price retracements in order to find the best entries in the market, but it include also other features which can be helpful for traders.
The indicator detects and highlight on the chart the market movement in multiple ways, including swing high, swing lows, the break of structure (BoS), change of character (CoCh), possible retracement movement, trend-lines generated through pivots, fibonacci and quarters theory levels based on previous pivot and daily, weekly and monthly highs and lows.
It can be set up on two different pivots look-back, one faster and one slower, to simplify the development of strategies for traders.
A longer look-back can detect a "slower" and less noisy structure, which can be more useful to detect massive retracements, while a shorter look-back can be useful to detect faster market moves, perfect for scalpers and to develop small price movement strategies.
Indicator features:
- Trend detection highlighted with colors - candles are colored in four different colors, and it's possible to choose if detect the fast and slow trend:
• Bullish move after structure break – green
• Bullish retracements – gray
• Bearish move after structure break – purple
• Bearish retracements – white
In this way traders can have a realtime vision of when the market is retracing in order to find better entries than entry immediately on a break of structure. It can be integrated with order blocks, ema or others indicators which can be helpful as support or resistance.
- Pivots and structure labels - in order to identify immediately if the trend is bullish, bearish or is changing direction:
• BoS + and BoS - are the bullish and bearish break of structure, respectively, and are colored to indicate a slower look-back, in gray to indicate a faster pivot look-back
• CoCh + and CoCh - are the bullish and bearish change of characters, respectively, and are colored to indicate a slower look-back.
• HH, HL, LL, and LH indicate the pivots of the trend. Al the pivots appear just when the pivots, based on fast or slow pivot look-back are confirmed
- Zigzag - The zigzag line helps to remove market noise and read the market structure in a simpler way.
• It's possible to select the zigzag line based on the slow or fast trend.
• Fast pivot look-back
•Slow pivot look-back
- Quarters theory and Fibonacci retracement:
• It creates a retracement that can be based on the fast or slow trend and small or big market move.
• The retracement is both bullish and bearish and includes the major Fibonacci levels and the most valuable areas from the quarters theory of market retracement.
• This helps to detect good entry points.
- Support and resistance, Daily, weekly, and monthly high, lows - just to heave a more clear view of important levels:
• It plots the highest and lowest pivot points based on the selected look-back.
• It plots the highs and lows of the day, week, and month.
- Trendlines:
• It plots the trend-lines based on past pivots.
• Here as well, it is possible to choose between fast and slow trend pivot look-back.
It's important to highlight that the indicator remarks on all facets of pure price action, not the smart money concept or liquidity areas.
Please note that this indicator is for educational purposes only and should not be used for trading without further testing and analysis.
חפש סקריפטים עבור "order block"
ICT SM Trades PREMIUMIndicator looks for ICT & Smart Money trades on any timeframe. These types of trades reveal how the big institutions, banks and hedge funds trade with big money. If they want their very big positions to be filled they need to find areas in chart where the majority of the money is sitting. Where is it? Where is the majority of orders placed? Right below supports or right above resistance, these orders are stoplosses or stop orders. So they need to push the price to these areas, take all the available stoplosses and trigger all the available stop orders in order to fill their positions and then push the price to the opposite side to make profit (and retail to lose).
Indicator looks for support or resistance (S/R) areas which are represented by dotted lines. This S/R areas are created by minimum of 2 pivot high/low (H/L). Every pivot H/L that creates the S/R area is marked with diamond label. This S/R area is called liquidity. After liquidity is created, indicator looks for liquidity grab (mostly represented by fast spike to this area - it is labeled with x-cross) and then price should go fast to the opposite side of the created structure. Indicator considers as a created structure everything that was created on the other side of the candles from the oldest pivot H/L which creates particular liquidity. For example, if liquidity is created with 3 pivot highs, indicator looks at the oldest pivot high and from there it is looking for the lowest low. Under this lowest low is dashed line which means that this level should be broken with closed candle. This action is called market structure shift (MSS), when the price shifted very fast from highs to lows. After MSS, when the price went fast to one direction, there were some imbalances in prices, in our example selling pressure was a lot bigger than buying pressure and there were created some long untested bearish candles. This untested areas in candles are called imbalances or gaps of fair value gaps (FVG). These are labeled with rectangles. It is expected that these gaps will be tested in near future to "balance the market".
We can put limit orders into these gaps (or into order blocks in PREMIUM indicator) and await some retracement after MSS to open our positions and after the positions are opened we can expect trend continuation in the direction where market structure shift was made (away from liquidity grab). So stoplosses can be placed above/below liquidity grab candle (marked with x-cross).
Alerts can be set for MSS to Long & Short and for liquidity grabs to Long & Short.
All settings of this indicator should be self-explanatory and most of them have tooltips for better understanding.
ArtiumPro Smart Money ConceptsSmart money concepts refer to the use of institutional trading strategies which align with the perspectives of Smart Money in the market. i.e. the composite man. Market Structure is the foundation of price action trading, understanding price action is fundamental to SMC.
ArtiumPro SMC 2.1 is an SMC (Smart Money Concepts) indicator full of features to aid SMC traders. Our aim is to save you time with automatic chart mark-up and help you spot areas of interest you may miss with the naked eye.
Fvg (Fair Value Gap) - is also known as an imbalance. An FVG is an imbalance of orders, for instance, for sellers to complete their trades, there must be buyers and vice versa so when a market receives too many of one kind of order buys or sells, and not enough of the order's counterpart. When the amount is not balanced and too many orders are put in for one direction, it creates an imbalance.
Multi timeframe FVG - this will show the same as above but on the higher timeframe you choose. It’ll show as 2 lines that show the higher timeframe fvg with a filled box that mitigates on entry.
Order Blocks - These are supply and demand zones, displayed typically as the last down/up candle before a move in the opposite direction. Great POI’s for entry and take profits.
Outside candle - this is a candle that sweeps the highs and lows of the previous candle, best used for the 1 hour or above these can indicate a change of price direction.
Previous day high & low
Not only does it show your previous day's low and high but it also shows your opening and close of the day. You have settings where you can turn off the open and close and just have daily highs and lows. It’s your choice within your settings.
Market Structure - We have packed this feature with options that are customizable for you,
Break of Structure (BOS) indicates a trend continuation.
Change of Character (CHoCH) indicates the first sign of a possible trend change.
Equal Highs/lows - this will mark your double/triple tops and bottoms.
Retracement - set this to your preferred retracement amount to customize your market structure to what you qualify as a valid pullback.
Elliott Wave ZigZag
Many people ask for the Elliott Waves. Well, here it is, inside this SMC. Just like your pivot highs and lows, the Elliott Wave is showing in real-time so you can see where your previous highs and lows are with the Elliott Wave break of structures that you can use in conjunction with the Smart Money Concepts Indicator of ArtiumPro.
Fib levels - for Premium & Discount areas - in this Instance the fib is used to determine if the price has pulled back into a premium or discount zone for optimal trade entry.
Trading Sessions
One of the most advanced trading session indicators out there and it’s included inside the most advanced SMC indicator on the market today. It has open breakout and settings to filter the opening range along with your pip daily range. You can select what timezone you are in and it automatically adjusts on the chart. Cool right? Hope you enjoy it, happy trading!
Harmonic Super GuppyHarmonic Super Guppy – Harmonic & Golden Ratio Trend Analysis Framework
Overview
Harmonic Super Guppy is a comprehensive trend analysis and visualization tool that evolves the classic Guppy Multiple Moving Average (GMMA) methodology, pioneered by Daryl Guppy to visualize the interaction between short-term trader behavior and long-term investor trends. into a harmonic and phase-based market framework. By combining harmonic weighting, golden ratio phasing, and multiple moving averages, it provides traders with a deep understanding of market structure, momentum, and trend alignment. Fast and slow line groups visually differentiate short-term trader activity from longer-term investor positioning, while adaptive fills and dynamic coloring clearly illustrate trend coherence, expansion, and contraction in real time.
Traditional GMMA focuses primarily on moving average convergence and divergence. Harmonic Super Guppy extends this concept, integrating frequency-aware harmonic analysis and golden ratio modulation, allowing traders to detect subtle cyclical forces and early trend shifts before conventional moving averages would react. This is particularly valuable for traders seeking to identify early trend continuation setups, preemptive breakout entries, and potential trend exhaustion zones. The indicator provides a multi-dimensional view, making it suitable for scalping, intraday trading, swing setups, and even longer-term position strategies.
The visual structure of Harmonic Super Guppy is intentionally designed to convey trend clarity without oversimplification. Fast lines reflect short-term trader sentiment, slow lines capture longer-term investor alignment, and fills highlight compression or expansion. The adaptive color coding emphasizes trend alignment: strong green for bullish alignment, strong red for bearish, and subtle gray tones for indecision. This allows traders to quickly gauge market conditions while preserving the granularity necessary for sophisticated analysis.
How It Works
Harmonic Super Guppy uses a combination of harmonic averaging, golden ratio phasing, and adaptive weighting to generate its signals.
Harmonic Weighting : Each moving average integrates three layers of harmonics:
Primary harmonic captures the dominant cyclical structure of the market.
Secondary harmonic introduces a complementary frequency for oscillatory nuance.
Tertiary harmonic smooths higher-frequency noise while retaining meaningful trend signals.
Golden Ratio Phase : Phases of each harmonic contribution are adjusted using the golden ratio (default φ = 1.618), ensuring alignment with natural market rhythms. This reduces lag and allows traders to detect trend shifts earlier than conventional moving averages.
Adaptive Trend Detection : Fast SMAs are compared against slow SMAs to identify structural trends:
UpTrend : Fast SMA exceeds slow SMA.
DownTrend : Fast SMA falls below slow SMA.
Frequency Scaling : The wave frequency setting allows traders to modulate responsiveness versus smoothing. Higher frequency emphasizes short-term moves, while lower frequency highlights structural trends. This enables adaptation across asset classes with different volatility characteristics.
Through this combination, Harmonic Super Guppy captures micro and macro market cycles, helping traders distinguish between transient noise and genuine trend development. The multi-harmonic approach amplifies meaningful price action while reducing false signals inherent in standard moving averages.
Interpretation
Harmonic Super Guppy provides a multi-dimensional perspective on market dynamics:
Trend Analysis : Alignment of fast and slow lines reveals trend direction and strength. Expanding harmonics indicate momentum building, while contraction signals weakening conditions or potential reversals.
Momentum & Volatility : Rapid expansion of fast lines versus slow lines reflects short-term bullish or bearish pressure. Compression often precedes breakout scenarios or volatility expansion. Traders can quickly gauge trend vigor and potential turning points.
Market Context : The indicator overlays harmonic and structural insights without dictating entry or exit points. It complements order blocks, liquidity zones, oscillators, and other technical frameworks, providing context for informed decision-making.
Phase Divergence Detection : Subtle divergence between harmonic layers (primary, secondary, tertiary) often signals early exhaustion in trends or hidden strength, offering preemptive insight into potential reversals or sustained continuation.
By observing both structural alignment and harmonic expansion/contraction, traders gain a clear sense of when markets are trending with conviction versus when conditions are consolidating or becoming unpredictable. This allows for proactive trade management, rather than reactive responses to lagging indicators.
Strategy Integration
Harmonic Super Guppy adapts to various trading methodologies with clear, actionable guidance.
Trend Following : Enter positions when fast and slow lines are aligned and harmonics are expanding. The broader the alignment, the stronger the confirmation of trend persistence. For example:
A fast line crossover above slow lines with expanding fills confirms momentum-driven continuation.
Traders can use harmonic amplitude as a filter to reduce entries against prevailing trends.
Breakout Trading : Periods of line compression indicate potential volatility expansion. When fast lines diverge from slow lines after compression, this often precedes breakouts. Traders can combine this visual cue with structural supports/resistances or order flow analysis to improve timing and precision.
Exhaustion and Reversals : Divergences between harmonic components, or contraction of fast lines relative to slow lines, highlight weakening trends. This can indicate liquidity exhaustion, trend fatigue, or corrective phases. For example:
A flattening fast line group above a rising slow line can hint at short-term overextension.
Traders may use these signals to tighten stops, take partial profits, or prepare for contrarian setups.
Multi-Timeframe Analysis : Overlay slow lines from higher timeframes on lower timeframe charts to filter noise and trade in alignment with larger market structures. For example:
A daily bullish alignment combined with a 15-minute breakout pattern increases probability of a successful intraday trade.
Conversely, a higher timeframe divergence can warn against taking counter-trend trades in lower timeframes.
Adaptive Trade Management : Harmonic expansion/contraction can guide dynamic risk management:
Stops may be adjusted according to slow line support/resistance or harmonic contraction zones.
Position sizing can be modulated based on harmonic amplitude and compression levels, optimizing risk-reward without rigid rules.
Technical Implementation Details
Harmonic Super Guppy is powered by a multi-layered harmonic and phase calculation engine:
Harmonic Processing : Primary, secondary, and tertiary harmonics are calculated per period to capture multiple market cycles simultaneously. This reduces noise and amplifies meaningful signals.
Golden Ratio Modulation : Phase adjustments based on φ = 1.618 align harmonic contributions with natural market rhythms, smoothing lag and improving predictive value.
Adaptive Trend Scaling : Fast line expansion reflects short-term momentum; slow lines provide structural trend context. Fills adapt dynamically based on alignment intensity and harmonic amplitude.
Multi-Factor Trend Analysis : Trend strength is determined by alignment of fast and slow lines over multiple bars, expansion/contraction of harmonic amplitudes, divergences between primary, secondary, and tertiary harmonics and phase synchronization with golden ratio cycles.
These computations allow the indicator to be highly responsive yet smooth, providing traders with actionable insights in real time without overloading visual complexity.
Optimal Application Parameters
Asset-Specific Guidance:
Forex Majors : Wave frequency 1.0–2.0, φ = 1.618–1.8
Large-Cap Equities : Wave frequency 0.8–1.5, φ = 1.5–1.618
Cryptocurrency : Wave frequency 1.2–3.0, φ = 1.618–2.0
Index Futures : Wave frequency 0.5–1.5, φ = 1.618
Timeframe Optimization:
Scalping (1–5min) : Emphasize fast lines, higher frequency for micro-move capture.
Day Trading (15min–1hr) : Balance fast/slow interactions for trend confirmation.
Swing Trading (4hr–Daily) : Focus on slow lines for structural guidance, fast lines for entry timing.
Position Trading (Daily–Weekly) : Slow lines dominate; harmonics highlight long-term cycles.
Performance Characteristics
High Effectiveness Conditions:
Clear separation between short-term and long-term trends.
Moderate-to-high volatility environments.
Assets with consistent volume and price rhythm.
Reduced Effectiveness:
Flat or extremely low volatility markets.
Erratic assets with frequent gaps or algorithmic dominance.
Ultra-short timeframes (<1min), where noise dominates.
Integration Guidelines
Signal Confirmation : Confirm alignment of fast and slow lines over multiple bars. Expansion of harmonic amplitude signals trend persistence.
Risk Management : Place stops beyond slow line support/resistance. Adjust sizing based on compression/expansion zones.
Advanced Feature Settings :
Frequency tuning for different volatility environments.
Phase analysis to track divergences across harmonics.
Use fills and amplitude patterns as a guide for dynamic trade management.
Multi-timeframe confirmation to filter noise and align with structural trends.
Disclaimer
Harmonic Super Guppy is a trend analysis and visualization tool, not a guaranteed profit system. Optimal performance requires proper wave frequency, golden ratio phase, and line visibility settings per asset and timeframe. Traders should combine the indicator with other technical frameworks and maintain disciplined risk management practices.

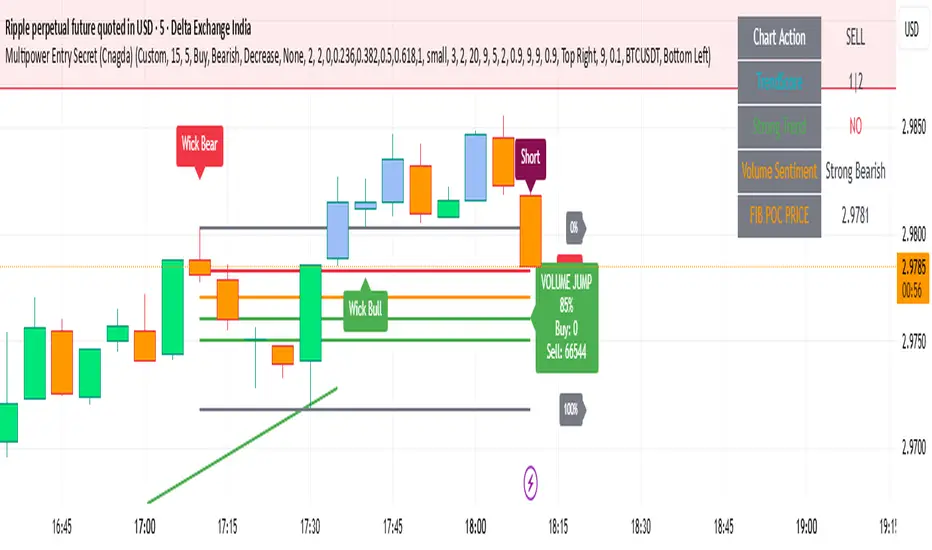
Multipower Entry SecretMultipower Entry Secret indicator is designed to be the ultimate trading companion for traders of all skill levels—especially those who struggle with decision-making due to unclear or overwhelming signals. Unlike conventional trading systems cluttered with too many lines and confusing alerts, this indicator provides a clear, adaptive, and actionable guide for market entries and exits.
Key Points:
Clear Buy/Sell/Wait Signals:
The script dynamically analyzes price action, candle patterns, volume, trend strength, and higher time frame context. This means it gives you “Buy,” “Sell,” or “Wait” signals based on real, meaningful market information—filtering out the noise and weak trades.
Multi-Timeframe Adaptive Analysis:
It synchronizes signals between higher and current timeframes, ensuring you get the most reliable direction—reducing the risk of getting caught in fake moves or sudden reversals.
Automatic Support, Resistance & Liquidity Zones:
Key levels like support, resistance, and liquidity zones are auto-detected and displayed directly on the chart, helping you make precise decisions without manual drawing.
Real-Time Dashboard:
All relevant information, such as trend strength, market intent, volume sentiment, and the reason behind each signal, is neatly summarized in a dashboard—making monitoring effortless and intuitive.
Customizable & Beginner-Friendly:
Whether you’re a newcomer wanting straightforward guidance or a professional needing advanced customization, the indicator offers flexible options to adjust analysis depth, timeframes, sensitivity, and more.
Visual & Clutter-Free:
The design ensures that your chart remains clean and readable, showing only the most important information. This minimizes mental overload and allows for instant decision-making.
Who Will Benefit?
Beginners who want to learn trading logic, avoid common traps, and see the exact reason behind every signal.
Advanced traders who require adaptive multi-timeframe analytics, fast execution, and stress-free monitoring.
Anyone who wants to save screen time, reduce analysis paralysis, and have more confidence in every trade they take.
1. No Indicator Clutter
Intent:
Many traders get confused by charts filled with too many indicators and signals. This often leads to hesitation, missed trades, or taking random, risky trades.
In this Indicator:
You get a clean and clutter-free chart. Only the most important buy/sell/wait signals and relevant support/resistance/liquidity levels are shown. These update automatically, removing the “overload” and keeping your focus sharp, so your decision-making is faster and stress-free.
2. Exact Entry Guide
Intent:
Traders often struggle with entry timing, leading to FOMO (fear of missing out) or getting trapped in sudden market reversals.
In this Indicator:
The system uses powerful adaptive logic to filter out weak signals and only highlight the strongest market moves. This not only prevents you from entering late or on noise, but also helps avoid losses from false breakouts or whipsaws. You get actionable suggestions—when to enter, when to hold back—so your entries are high-conviction and disciplined.
3. HTF+LTF Logic: Multitimeframe Sync Analysis
Intent:
Most losing trades happen when you act only on the short-term chart, ignoring the bigger market trend.
In this Indicator:
Signals are based on both the current chart timeframe (LTF) and a higher (HTF, like hourly/daily) timeframe. The indicator synchronizes trend direction, momentum, and structure across both levels, quickly adapting to show you when both are aligned. This filtering results in “only trade with the bigger trend”—dramatically increasing your win rate and market confidence.
4. Auto Support/Resistance & Liquidity Zones
Intent:
Drawing support/resistance and liquidity zones manually is time-consuming and error-prone, especially for beginners.
In this Indicator:
The system automatically identifies and plots the most crucial support/resistance levels and liquidity zones on your chart. This is based on adaptive, real-time price and volume analysis. These zones highlight where major institutional activity, trap setups, or real breakouts/reversals are most likely, removing guesswork and giving you a clear reference for entries, exits, and stop placements.
5. Clear Action/Direction
Intent:
Traders need certainty—what does the market want right now? Most indicators are vague.
In this Indicator:
Your dashboard always displays in plain words (like “BUY”, “SELL”, or “WAIT”) what action makes sense in the current market phase. Whether it’s a bull trap, volume spike, wick reversal, or exhaustion—it’s interpreted and explained clearly. No more confusion—just direct, real-time advice.
6. For Everyone (Beginner to Pro)
Intent:
Most advanced indicators are overwhelming for new traders; simple ones lack depth for professionals.
In this Indicator:
It is simple enough for a beginner—just add it to the chart and instantly see what action to consider. At the same time, it includes advanced adaptive analysis, multi-timeframe logic, and customizable settings so professional traders can fine-tune it for their strategies.
7. Ideal Usage and User Benefits
Instant Decision Support:
Whenever you’re unsure about a trade, just look at the indicator’s suggestion for clarity.
Entry Learning:
Beginners get real-time “practice” by not only seeing signals, but also the reason behind them—improving your chart reading and market understanding.
Screen Time & Stress Reduction:
Clear, relevant information only; no noise, less fatigue, faster decisions.
Makes Trading Confident & Simple:
The smart dashboard splits actionable levels (HTF, LTF, action) so you never miss a move, avoid traps, and stay aligned with high-probability trades.
8. Advanced Input Settings (Smart Customization)
Explained with Examples:
Enable Wick Analysis:
Finds candles with strong upper/lower wicks (signs of rejection/buying/selling force), alerting you to hidden reversals and protecting from FOMO entries.
Enable Absorption:
Detects when heavy order flow from one side is “absorbed” by the other (shows where institutional buyers/sellers are likely active, helps spot fake breakouts).
Enable Unusual Breakout:
Highlights real breakouts—large volatility plus high volume—so you catch genuine moves and avoid random spikes.
Enable Range/Expansion:
Smartly flags sudden range expansions—when the market goes from quiet to volatile—so you can act at the start of real trends.
Trend Bar Lookback:
Adjusts how many bars/candles are used in trend calculations. Short (fast trades, more signals), long (more reliability, fewer whipsaws).
Bull/Bear Bars for Strong Trend Min:
Sets how many candles in a row must support a trend before calling it “strong”—prevents flipping signals, keeps you disciplined.
Volume MA Length:
Lets you adjust how many bars back volume is averaged—fine-tune for your asset and trading style for best volume signals.
Swing Lookback Bars:
Set how many bars to use for swing high/low detection—short (quick swing levels), long (stronger support/resistance).
HTF (Bias Window):
Decide which higher timeframe the indicator should use for big-picture market mood. Adjustable for any style (scalp, swing, position).
Adaptive Lookback (HTF):
Choose how much HTF history is used for detecting major extremes/zones. Quick adjust for more/less sensitivity.
Show Support/Resistance, Liquidity Zones, Trendlines:
Toggle them on/off instantly per your needs—keeps your chart relevant and tailored.
9. Live Dashboard Sections Explained
Intent HTF:
Shows if the bigger timeframe currently has a Bullish, Bearish, or Neutral (“Chop”) intent, based on strict volume/price body calculations. Instant clarity—no more guessing on trend bias.
HTF Bias:
Clear message about which side (buy/sell/sideways) controls the market on the higher timeframe, so you always trade with the “big money.”
Chart Action:
The central action for the current bar—Whether to Buy, Sell, or Wait—calculated from all indicator logic, not just one rule.
TrendScore Long/Short:
See how many candles in your chosen window were bullish or bearish, at a glance. Instantly gauge market momentum.
Reason (WHY):
Every time a signal appears, the “reason” cell tells you the primary logic (breakout, wick, strong trend, etc.) behind it. Full transparency and learning—never trade blindly.
Strong Trend:
Shows if the market is currently in a powerful trend or not—helping you avoid choppy, risky entries.
HTF Vol/Body:
Displays current higher timeframe volume and candle body %—helping spot when big players are active for higher probability trades.
Volume Sentiment:
A real-time analysis of market psychology (strong bullish/bearish, neutral)—making your decision-making much more confident.
10. Smart and User-Friendly Design
Multi-timeframe Adaptive:
All calculations can now be drawn from your choice of higher or current timeframe, ensuring signals are filtered by larger market context.
Flexible Table Position:
You can set the live dashboard/summary anywhere on the chart for best visibility.
Refined Zone Visualization:
Liquidity and order blocks are visually highlighted, auto-tuning for your settings and always cleaning up to stay clutter-free.
Multi-Lingual & Beginner Accessible:
With Hindi and simple English support, descriptions and settings are accessible for a wide audience—anyone can start using powerful trading logic with zero language barrier.
Efficient Labels & Clear Reasoning:
Signal labels and reasons are shown/removed dynamically so your chart stays informative, not messy.
Every detail of this indicator is designed to make trading both simpler and smarter—helping you avoid the common pitfalls, learn real price action, stay in sync with the market’s true mood, and act with discipline for higher consistency and confidence.
This indicator makes professional-grade market analysis accessible to everyone. It’s your trusted assistant for making smarter, faster, and more profitable trading decisions—providing not just signals, but also the “why” behind every action. With auto-adaptive logic, clear visuals, and strong focus on real trading needs, it lets you focus on capturing the moves that matter—every single time.
ADX Tide ZonesADX Tide Zones – Adaptive Momentum & Trend Strength Framework
Overview
ADX Tide Zones – Professional is a dynamic trend-strength visualizer designed for traders who want to interpret momentum with precision and context. By combining the Average Directional Index (ADX) with adaptive threshold logic, the indicator segments price action into distinct “tide zones” that reflect varying levels of market strength: Calm, Rising, Strong, and Falling Tides. These zones transform raw ADX readings into an interpretable framework that highlights when markets are consolidating, building momentum, trending strongly, or losing strength.
Unlike standard ADX readings, which can be difficult to interpret in real time, ADX Tide Zones translate momentum shifts into a continuous, color-coded system that traders can instantly read. Whether applied to scalping, intraday, or swing trading, the indicator offers a consistent methodology for identifying actionable opportunities across assets and timeframes.
How It Works
The foundation of ADX Tide Zones lies in momentum analysis via the ADX. By measuring the strength (not direction) of a trend, ADX provides an objective read on when markets are gaining or losing energy. ADX Tide Zones enhances this by applying threshold logic to classify ADX values into four distinct states:
Calm Tide : Low ADX values indicate sideways or consolidating conditions.
Rising Tide : ADX increases past a threshold, signaling momentum building.
Strong Tide : ADX remains elevated, confirming robust and sustained trend strength.
Falling Tide : ADX declines after strength, hinting at exhaustion or early reversal setups.
These states are displayed on the chart through adaptive visualizations (zones, bar colors, or overlays), offering real-time clarity on when to expect expansion, continuation, or contraction in price action.
Interpretation
Trend Analysis : By mapping transitions between tides, traders can instantly gauge whether markets are in accumulation, expansion, or exhaustion phases. Rising/Strong Tides reinforce trend continuation, while Falling Tides highlight weakening conditions.
Volatility & Risk Assessment : Shifts between Calm → Rising Tide often precede volatility expansions. Falling Tides can signal a period of compression or corrective moves, warning traders to manage risk proactively.
Market Context : The indicator does not dictate direction; instead, it overlays strength on top of price action, allowing traders to combine it with directional tools such as moving averages, order blocks, or liquidity zones for confirmation.
Strategy Integration
ADX Tide Zones adapts seamlessly to a wide range of trading strategies by translating momentum dynamics into actionable frameworks:
Trend Following : Traders can align with dominant flows by entering positions when the indicator confirms a Rising Tide or Strong Tide. These conditions signal persistent directional strength, making them ideal for continuation setups. Combining directional bias with ADX confirmation reduces the risk of trading against prevailing momentum.
Breakout Trading : When the market transitions from Calm Tide into a Rising Tide, it often precedes a volatility expansion. This shift highlights breakout conditions where accumulation gives way to impulsive price movement. Traders can use this transition as a timing tool to catch early entries into new momentum phases.
Exhaustion Reversals : Strong Tide phases don’t last forever—when they begin to fade into Falling Tide, it can mark trend fatigue or liquidity exhaustion. This offers contrarian traders an early edge in spotting overextended moves and positioning for corrective pullbacks or full reversals.
Multi-Timeframe Analysis : By overlaying higher timeframe tide zones on intraday or scalping charts, traders can filter noise and trade in alignment with larger flows. For example, combining a daily Rising Tide bias with a 15-minute breakout confirmation can significantly improve entry precision while reducing exposure to false signals.
Advanced Techniques
For traders seeking an extra edge, ADX Tide Zones can be pushed further with advanced methods:
Volume & Liquidity Confirmation : Pair the tide transitions with volume spikes, order flow, or liquidity sweep tools. When directional strength confirmed by the ADX coincides with institutional activity, it validates setups and increases probability of follow-through.
Cross-Asset Synchronization : Momentum rarely exists in isolation. Monitoring tide shifts across correlated instruments (e.g., majors vs. USD, or indices vs. risk assets) can uncover synchronized volatility events. These correlations help traders identify whether a move is isolated noise or part of a broader systemic trend.
Threshold Optimization : The sensitivity of ADX Tide Zones can be fine-tuned for different trading objectives. Lower thresholds heighten responsiveness, capturing micro-moves suitable for scalpers. Higher thresholds filter minor fluctuations, isolating major structural swings that align with swing or position trading.
Contextual Trade Management : Instead of using static stops or targets, traders can adapt risk management dynamically by tracking tide progression. For example, a trade initiated during Rising Tide may remain valid as long as conditions sustain, but partial profits or tighter stops can be applied once the zone shifts to Calm Tide.
Inputs & Customization
ADX Length : Define the lookback period for ADX calculation.
Threshold Levels : Adjust sensitivity for Calm, Rising, Strong, and Falling Tides.
Zone Visualization : Choose between bar coloring, background shading, or overlays.
Color Customization : Configure bullish, bearish, neutral, and tide-specific colors.
Multi-Timeframe Options : Enable tide readings from higher timeframes for confirmation.
Why Use ADX Tide Zones
ADX Tide Zones turns the complexity of momentum analysis into a visual system that highlights when markets are gearing up for moves, trending with conviction, or running out of steam. By combining adaptive ADX interpretation with customizable thresholds, traders can:
Anticipate breakouts before volatility expands.
Confirm the strength behind price trends.
Spot exhaustion phases early to secure profits or prepare for reversals.
Adapt strategies seamlessly between scalping, intraday, and swing trading.
With its balance of simplicity and depth, ADX Tide Zones provides a structured lens for reading market momentum, equipping traders with the clarity needed to execute with discipline and confidence.

AMD [TakingProphets]Overview
The AMD indicator is a real-time, high-resolution tool designed for traders following ICT methodology who want a clear visualization of higher timeframe (HTF) candles directly on their lower timeframe charts.
It overlays current HTF structure, including open, high, low, and close projections, allowing traders to align intraday decisions with institutional price delivery — all without switching timeframes.
Concept & Background
In ICT concepts, market behavior often follows a pattern of accumulation, manipulation, and distribution. Understanding these phases is essential for anticipating when price is likely to expand or reverse.
AMD automates this process by:
-Overlaying HTF candles directly on your lower timeframe chart.
-Projecting live levels like the current open, high, low, and close to map out evolving bias.
-Helping traders see whether price is accumulating orders, engineering liquidity sweeps, or distributing aggressively.
Key Features
Live HTF Candle Overlay
-Displays the full HTF candle — body, wicks, and directional bias — on your active chart in real time.
-Perfect for traders aligning intraday setups with broader HTF context.
Dynamic HTF Price Projections
-Plots the evolving open, high, low, and close for the current HTF candle.
-Each projection can be customized by color, style, labels, and visibility to fit your workflow.
Full Customization Control
-Adjust candle body widths, wick styles, and transparency.
-Configure projection lines and time labels in both 12h and 24h formats.
-Includes an optional Info Box showing instrument, timeframe, and session context.
Session Timing & Labeling
-Smart timestamping marks the start and close of each HTF candle.
-Helps traders anticipate potential expansions or reversals during killzones or liquidity events.
How to Use It
Select Your HTF Context
-Choose any timeframe overlay (e.g., 1H, 4H, 1D) to match your trading model.
-Monitor Live HTF Levels
-Watch how price interacts with current HTF highs, lows, and equilibrium levels in real time.
-Integrate With ICT Concepts
-Use alongside tools like SMT divergence, Order Blocks, or Liquidity Levels for confirmation and context.
-Refine Intraday Entries
-Check whether price is expanding in your favor before entering positions.
Best Practices
Combine AMD with ICT killzone sessions to monitor HTF behavior during high-liquidity periods.
Use it alongside correlated SMT divergence tools for stronger directional bias confirmation.
Who It’s For
Scalpers anchoring quick entries to HTF sentiment.
Intraday traders syncing 5m/15m setups with 1H/4H context.
Swing traders monitoring HTF ranges without switching charts.
Educators & analysts needing clean visual overlays for teaching and content creation.
Why It’s Useful
AMD doesn’t provide trading signals or predictive guarantees. Instead, it offers a clean, structured view of HTF price delivery — enabling traders to understand institutional intent as it unfolds and manage their execution with greater confidence.

Simple Liquidity Zones [Supertrade]🔎 What this indicator does
This indicator is designed to highlight liquidity sweep zones on the chart.
• A liquidity sweep occurs when price briefly breaks above a recent swing high or below a recent swing low, but fails to close beyond it.
• Such behavior often indicates that price has taken liquidity (stop orders resting above highs or below lows) and may reverse.
The indicator marks these events as bullish or bearish liquidity zones:
• Bullish Zone (green) → Price swept a swing low and closed back above it (possible bullish reversal area).
• Bearish Zone (red) → Price swept a swing high and closed back below it (possible bearish reversal area).
These zones are drawn as shaded horizontal bands that extend forward in time, providing visual areas where liquidity grabs occurred.
________________________________________
⚙️ How calculations are made
The indicator does not use moving averages or smoothing.
Instead, it works with raw price action:
1. Swing Detection → It checks the highest high and lowest low of the past N bars (swing length).
2. Sweep Logic →
o A bearish sweep happens if the high breaks above the previous swing high, but the close returns below that level.
o A bullish sweep happens if the low breaks below the previous swing low, but the close returns above that level.
3. Zone Creation → When a sweep is detected, a shaded zone is drawn just above/below the swing level.
4. Persistence → Zones extend into the future until replaced by new ones (or optionally until price fully trades through them).
This makes the calculations simple, transparent, and responsive to actual market structure without lag.
________________________________________
📈 How it helps traders
This tool helps traders by:
• Visualizing liquidity areas → Shows where price previously swept liquidity and may act as support/resistance.
• Identifying reversals → Helps spot potential turning points after liquidity grabs.
• Risk management → Zones highlight areas where stops may be targeted, useful for positioning stop-loss orders.
• Confluence tool → Works best when combined with other strategies such as order blocks, trendlines, or volume analysis.
⚠️ Note: Like all indicators, this should not be used in isolation. It provides context, not guaranteed trade signals.
________________________________________
🏦 Markets & Timeframes
• Works across all markets (crypto, forex, stocks, indices, commodities).
• Particularly effective in high-liquidity environments where stop-hunting is common (e.g., forex majors, BTC/ETH, S&P500).
• Timeframes:
o Lower timeframes (1m–15m) → Scalpers can spot intraday liquidity sweeps.
o Higher timeframes (1H–1D) → Swing traders can identify major liquidity pools.
________________________________________

MistaB SMC Navigation ToolkitMistaB SMC Navigation Toolkit
A complete Smart Money Concepts (SMC) toolkit designed for precision navigation of market structure, order flow, and premium/discount trading zones. Perfect for traders following ICT-style concepts and multi-timeframe confluence.
Features
✅ Order Blocks (OBs)
• Automatic bullish & bearish OB detection
• Optional displacement & high-volume filters
• Midline display for quick equilibrium view
• Auto-expiry and broken OB cleanup
✅ Fair Value Gaps (FVGs)
• Bullish & bearish gap detection
• HTF bias filtering for higher accuracy
• Compact boxes with labels
• Automatic removal when filled
✅ Market Structure (BoS / CHoCH)
• Fractal-based swing detection
• Break of Structure & Change of Character labeling
• Dynamic HTF bias dimming
✅ Premium / Discount Zones
• Auto-calculated mid-level
• Highlighted zones for optimal trade placement
✅ Higher Timeframe (HTF) Confirmation
• Configurable confirmation timeframe
• On-chart HTF status label (Bullish / Bearish / Not Required)
✅ Automatic Cleanup System
• Fast or delayed cleanup for expired/broken zones
• Dimmed colors for invalidated levels
How to Use
Set your preferred HTF in the settings.
Look for OB/FVGs aligned with HTF bias.
Enter in discount zones for longs or premium zones for shorts.
Confirm with BoS / CHoCH signals before entry.
Manage trades towards opposing liquidity zones or HTF levels.
Disclaimer
This indicator is for educational purposes only. It does not provide financial advice or guarantee future results. Always practice proper risk management and test thoroughly before live trading.

MistaB SMC Navigation Toolkit MistaB SMC Navigation Toolkit
A complete Smart Money Concepts (SMC) toolkit designed for precision navigation of market structure, order flow, and premium/discount trading zones. Perfect for traders following ICT-style concepts and multi-timeframe confluence.
Features
✅ Order Blocks (OBs)
• Automatic bullish & bearish OB detection
• Optional displacement & high-volume filters
• Midline display for quick equilibrium view
• Auto-expiry and broken OB cleanup
✅ Fair Value Gaps (FVGs)
• Bullish & bearish gap detection
• HTF bias filtering for higher accuracy
• Compact boxes with labels
• Automatic removal when filled
✅ Market Structure (BoS / CHoCH)
• Fractal-based swing detection
• Break of Structure & Change of Character labeling
• Dynamic HTF bias dimming
✅ Premium / Discount Zones
• Auto-calculated mid-level
• Highlighted zones for optimal trade placement
✅ Higher Timeframe (HTF) Confirmation
• Configurable confirmation timeframe
• On-chart HTF status label (Bullish / Bearish / Not Required)
✅ Automatic Cleanup System
• Fast or delayed cleanup for expired/broken zones
• Dimmed colors for invalidated levels
How to Use
Set your preferred HTF in the settings.
Look for OB/FVGs aligned with HTF bias.
Enter in discount zones for longs or premium zones for shorts.
Confirm with BoS / CHoCH signals before entry.
Manage trades towards opposing liquidity zones or HTF levels.
Disclaimer
This indicator is for educational purposes only. It does not provide financial advice or guarantee future results. Always practice proper risk management and test thoroughly before live trading.

Wickless Tap Signals Wickless Tap Signals — TradingView Indicator (v6)
A precision signal-only tool that marks BUY/SELL events when price “retests” the base of a very strong impulse candle (no wick on the retest side) in the direction of trend.
What it does (in plain English)
Finds powerful impulse candles:
Bull case: a green candle with no lower wick (its open ≈ low).
Bear case: a red candle with no upper wick (its open ≈ high).
Confirms trend with an EMA filter:
Only looks for bullish bases while price is above the EMA.
Only looks for bearish bases while price is below the EMA.
Waits for the retest (“tap”):
Later, if price revisits the base of that wickless candle
Bullish: taps the candle’s low/open → BUY signal
Bearish: taps the candle’s high/open → SELL signal
Optional level “consumption” so each base can trigger one signal, not many.
The idea: a wickless impulse often marks strong initiative order flow. The first retest of that base frequently acts as a springboard (bull) or ceiling (bear).
Exact rules (formal)
Let tick = syminfo.mintick, tol = tapTicks * tick.
Trend filter
inUp = close > EMA(lenEMA)
inDn = close < EMA(lenEMA)
Wickless impulse candles (confirmed on bar close)
Bullish wickless: close > open and abs(low - open) ≤ tol
Bearish wickless: close < open and abs(high - open) ≤ tol
When such a candle closes with trend alignment:
Store bullTapLevel = low (for bull case) and its bar index.
Store bearTapLevel = high (for bear case) and its bar index.
Signals (must happen on a later bar than the origin)
BUY: low ≤ bullTapLevel + tol and inUp and bar_index > bullBarIdx
SELL: high ≥ bearTapLevel - tol and inDn and bar_index > bearBarIdx
One-shot option
If enabled, once a signal fires, the stored level is cleared so it won’t trigger again.
Inputs (Settings)
Trend EMA Length (lenEMA): Default 200.
Use 50–100 for intraday, 200 for swing/position.
Tap Tolerance (ticks) (tapTicks): Default 1.
Helps account for tiny feed discrepancies. Set 0 for strict equality.
One Signal per Level (oneShot): Default ON.
If OFF, multiple taps can create multiple signals.
Plot Tap Levels (plotLevels): Draws horizontal lines at active bases.
Show Pattern Labels (showLabels): Marks the origin wickless candles.
Plots & Visuals
EMA trend line for context.
Tap Levels:
Green line at bullish base (origin candle’s low/open).
Red line at bearish base (origin candle’s high/open).
Signals:
BUY: triangle-up below the bar on the tap.
SELL: triangle-down above the bar on the tap.
Labels (optional):
Marks the original wickless impulse candle that created each level.
Alerts
Two alert conditions are built in:
“BUY Signal” — fires when a bullish tap occurs.
“SELL Signal” — fires when a bearish tap occurs.
How to set:
Add the indicator to your chart.
Click Alerts (⏰) → Condition = this indicator.
Choose BUY Signal or SELL Signal.
Set your alert frequency and delivery method.
Recommended usage
Timeframes: Works on any; start with 5–15m intraday, or 1H–1D for swing.
Markets: Equities, futures, FX, crypto. For thin/illiquid assets, consider a slightly larger Tap Tolerance.
Confluence ideas (optional, but helpful):
Higher-timeframe trend agreeing with your chart timeframe.
Volume surge on the origin wickless candle.
S/R, order blocks, or SMC structures near the tap level.
Avoid major news moments when slippage is high.
No-repaint behavior
Origin patterns are detected only on bar close (barstate.isconfirmed), so bases are created with confirmed data.
Signals come after the origin bar, on subsequent taps.
There is no lookahead; lines and shapes reflect information known at the time.
(As with all real-time indicators, an intrabar tap can trigger an alert during the live bar; the signal then remains if that condition held at bar close.)
Known limitations & design choices
Single active level per side: The script tracks only the most recent bullish base and most recent bearish base.
Want a queue of multiple simultaneous bases? That’s possible with arrays; ask and we’ll extend it.
Heikin Ashi / non-standard candles: Wick definitions change; for consistent behavior use regular OHLC candles.
Gaps: On large gaps, taps can occur instantly at the open. Consider one-shot ON to avoid rapid repeats.
This is an indicator, not a strategy: It does not place trades or compute PnL. For backtesting, we can convert it into a strategy with SL/TP logic (ATR or structure-based).
Practical tips
Tap Tolerance:
If you miss obvious taps by a hair, increase to 1–2 ticks.
For FX/crypto with tiny ticks, even 0 or 1 is often enough.
EMA length:
Shorten for faster signals; lengthen for cleaner trend selection.
Risk management (manual suggestion):
For BUY signals, consider a stop slightly below the tap level (or ATR-based).
For SELL signals, consider a stop slightly above the tap level.
Scale out or trail using structure or ATR.
Quick checklist
✅ Price above EMA → watch for a green no-lower-wick candle → store its low → BUY on tap.
✅ Price below EMA → watch for a red no-upper-wick candle → store its high → SELL on tap.
✅ Use Tap Tolerance to avoid missing precise touches by one tick.
✅ Consider One Signal per Level to keep trades uncluttered.
FAQ
Q: Why did I not get a signal even though price touched the level?
A: Check Tap Tolerance (maybe too strict), trend alignment at the tap bar, and that the tap happened after the origin candle. Also confirm you’re on regular candles.
Q: Can I see multiple bases at once?
A: This version tracks the latest bull and bear bases. We can extend to arrays to keep N recent bases per side.
Q: Will it repaint?
A: No. Bases form on confirmed closes, and signals only on later bars.
Q: Can I backtest it?
A: This is a study. Ask for the strategy variant and we’ll add entries, exits, SL/TP, and stats.

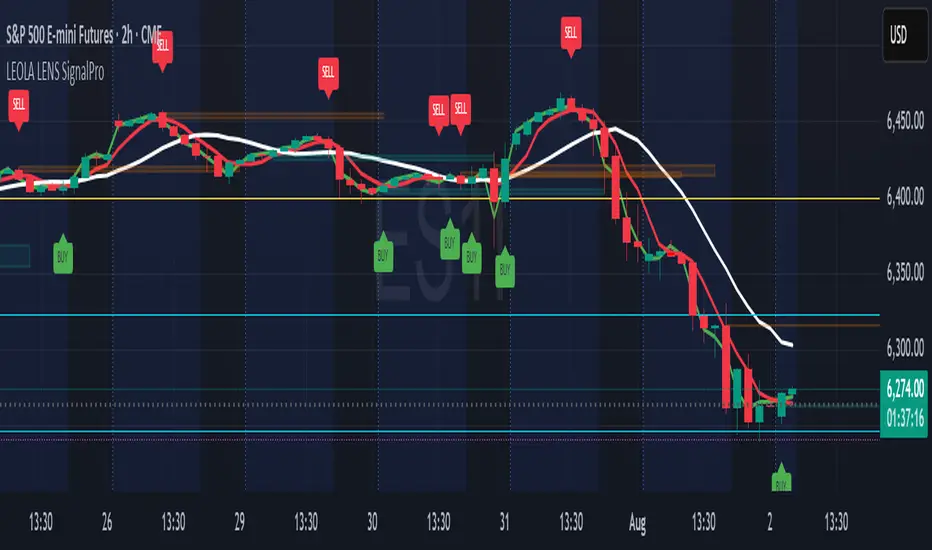
Leola Lens SignalPro📌 Leola Lens SignalPro — Structure-Aware Momentum Overlay (Invite-Only)
This script is designed for traders who prioritize clear structure, liquidity trap zones, and momentum transitions. It provides adaptive visual overlays that align with key decision points — emphasizing structure over lagging indicators.
________________________________________
⚙️ Core Operating Modes
✅ Momentum Shift Mode (Always Active)
Tracks microstructure shifts using volatility compression, imbalance reactions, and adaptive logic for directional bias.
⚡ Scalper Mode (Optional)
Activates fast-response overlays for 1m–15m charts — tuned for crypto, indices, and intraday setups.
🛡 Safeguard Mode (Optional)
Applies volume and exhaustion filters for higher timeframe or conservative entries, ideal for swing traders.
________________________________________
📦 Liquidity Control Box (LCB) Logic
🔵 Blue Box = Bullish Control
• Break above → continuation likely
• Break below → caution for reversal
🟧 Orange Box = Bearish Control
• Break below → continuation likely
• Break above → caution for squeeze
Use the last visible box for bias.
Box edges = confluence zones.
Box overlaps = consolidation → avoid impulsive trades.
________________________________________
🧠 Signal Logic & Concept
Built using a custom structural engine, not derived from public scripts like RSI, MACD, or WaveTrend.
The overlays aim to capture price behavior often aligned with institutional concepts, such as:
• Order Blocks
• Liquidity Sweeps
• Trap Reversals
• Mitigation Moves
Pairs well with SMC-style analysis and order-flow-based trading.
________________________________________
🟡 Visual Signal Layers
• BUY / SELL Labels → Appear near structure flips and trap zones
• Yellow Label → High-risk trend shift zone
• LCB Boxes → Real-time market control zones
• Green/Red Liquidity Zones → Absorption or rejection
• MA Overlays → Adaptive slope-based guidance (optional)
• Pink Lines → High-reactivity reversal zones
• Yellow Line → Soft S/R (psychological pivot)
________________________________________
🎯 Suggested Entry & Exit Cues (Educational Use Only)
✅ Entry
• BUY near Blue LCB + liquidity reaction
• SELL after extended rallies into Orange LCB + trap behavior
• ⚠ Avoid trades directly at Yellow Labels unless other context supports
✅ Exit
• On opposite label after structure break
• On formation of opposite LCB
• Near major liquidity zones or pink levels
🧪 Always backtest label behavior to fit your strategy before use.
________________________________________
🔍 Originality Justification
This script introduces a non-indicator-based approach to structure detection — combining real-time volatility response, adaptive liquidity logic, and multi-mode filtering. It avoids conventional oscillators in favor of clarity-driven visual overlays, offering a novel experience especially useful to discretionary traders.
________________________________________
⚠️ Disclaimer
This script is for educational and informational purposes only. It does not constitute financial advice or a trading signal. Always validate performance with backtesting and forward testing before live use.
________________________________________
Titan Wick Zone IndicatorThe Titan Wick Zone Indicator visually highlights the upper and lower wick regions of each candlestick on your chart, helping traders instantly identify areas where price was aggressively rejected (top wick) or absorbed (bottom wick). The indicator fills the area above the candle body to the wick high in red (sell zone), and the area below the candle body to the wick low in green (buy zone), both with adjustable opacity for clear visibility.
How to Use:
Spot Rejection and Absorption:
The red-filled upper wick zone marks where upward price moves were sharply rejected by sellers, often indicating supply, resistance, or “stop hunt” zones.
The green-filled lower wick zone marks where downward price moves were absorbed by buyers, pointing to potential demand, support, or accumulation zones.
Enhance Price Action Analysis:
Use these zones to avoid entering trades at price extremes, spot potential reversals, and find areas of confluence with support/resistance, Fibonacci levels, or order blocks.
Risk Management:
The indicator helps visualize where liquidity hunts or false breakouts may occur, so you can better place stop losses outside of volatile wick zones.
Ideal For:
Price action traders, scalpers, and swing traders seeking a visual edge in spotting supply/demand dynamics, liquidity zones, and wick-driven traps.

Impulse Alert - Supply (Sell) [Fixed]🟥 Supply Zone (Sell) – Institutional Order Block Detector
This custom indicator automatically detects valid Supply Zones (Sell Zones) based on Smart Money Concepts and institutional trading behavior.
🔍 How It Works:
Identifies strong bearish impulsive moves after price forms a potential Order Block
Valid supply zones are plotted after:
A valid rally–base–drop or drop–base–drop structure
A shift in structure or clear imbalance is detected
The zone is created from the last bullish candle before a strong bearish engulfing move
Zones remain on chart until price revisits and reacts
📊 Use Case:
Ideal for traders using Smart Money Concepts (SMC), Supply & Demand, or ICT-inspired strategies
Perfect for scalping, day trading, or swing setups
Designed for confluence with HTF bias and LTF execution
⚙️ Features:
Supply Zone auto-plotting
Customizable zone color and opacity
Alerts when price returns to the zone (retest entry opportunity)
🧠 Tip for Best Use:
Use in confluence with:
HTF Supply zones (manual or other indicator)
Market Structure breaks
Fair Value Gaps or Imbalance zones
Strong impulsive moves from HTF to LTF
🔁 Future Additions (Coming Soon):
Demand Zone detection
Zone strength rating system
Refined zone filters (volume, candle size, etc.)
Alerts for mitigation or invalidation
📌 Created by: Rohit Jadhav | Real-time market trader | YT/Insta - @GrowthByTrading
💬 Feedback? Drop a comment or connect via profile for updates and tutorials!

Fibonacci Optimal Entry Zone [OTE] (Zeiierman)█ Overview
Fibonacci Optimal Entry Zone (Zeiierman) is a high-precision market structure tool designed to help traders identify ideal entry zones during trending markets. Built on the principles of Smart Money Concepts (SMC) and Fibonacci retracements, this indicator highlights key areas where price is most likely to react — specifically within the "Golden Zone" (between the 50% and 61.8% retracement).
It tracks structural pivot shifts (CHoCH) and dynamically adjusts Fibonacci levels based on real-time swing tracking. Whether you're trading breakouts, pullbacks, or optimal entries, this tool brings unparalleled clarity to structure-based strategies.
Ideal for traders who rely on confluence, this indicator visually synchronizes swing highs/lows, market structure shifts, Fibonacci retracement levels, and trend alignment — all without clutter or lag.
⚪ The Structural Assumption
Price moves in waves, but key retracements often lead to continuation or reversal — especially when aligned with structure breaks and trend shifts.
The Optimal Entry Zone captures this behavior by anchoring Fibonacci levels between recent swing extremes. The most powerful area — the Golden Zone — marks where institutional re-entry is likely, providing traders with a sniper-like roadmap to structure-based entries.
█ How It Works
⚪ Structure Tracking Engine
At its core, the indicator detects pivots and classifies trend direction:
Structure Period – Determines the depth of pivots used to detect swing highs/lows.
CHoCH – Break of structure logic identifies where the trend shifts or continues, marked visually on the chart.
Bullish & Bearish Modes – Independently toggle uptrend and downtrend detection and styling.
⚪ Fibonacci Engine
Upon each confirmed structural shift, Fibonacci retracement levels are projected between swing extremes:
Custom Levels – Choose which retracements (0.50, 0.618, etc.) are shown.
Real-Time Adjustments – When "Swing Tracker" is enabled, levels and labels update dynamically as price forms new swings.
Example:
If you disable the Swing Tracker, the Golden Level is calculated using the most recent confirmed swing high and low.
If you enable the Swing Tracker, the Golden Level is calculated from the latest swing high or low, making it more adaptive as the trend evolves in real time.
█ How to Use
⚪ Structure-Based Entry
Wait for CHoCH events and use the resulting Fibonacci projection to identify entry points. Enter trades as price taps into the Golden Zone, especially when confluence forms with swing structure or order blocks.
⚪ Real-Time Reaction Tracking
Enable Swing Tracker to keep the tool live — constantly updating zones as price shifts. This is especially useful for scalpers or intraday traders who rely on fresh swing zones.
█ Settings
Structure Period – Number of bars used to define swing pivots. Larger values = stronger structure.
Swing Tracker – Auto-updates fib levels as new highs/lows form.
Show Previous Levels – Keep older fib zones on chart or reset with each structure shift.
-----------------
Disclaimer
The content provided in my scripts, indicators, ideas, algorithms, and systems is for educational and informational purposes only. It does not constitute financial advice, investment recommendations, or a solicitation to buy or sell any financial instruments. I will not accept liability for any loss or damage, including without limitation any loss of profit, which may arise directly or indirectly from the use of or reliance on such information.
All investments involve risk, and the past performance of a security, industry, sector, market, financial product, trading strategy, backtest, or individual's trading does not guarantee future results or returns. Investors are fully responsible for any investment decisions they make. Such decisions should be based solely on an evaluation of their financial circumstances, investment objectives, risk tolerance, and liquidity needs.

Dynamic Liquidity Depth [BigBeluga]
Dynamic Liquidity Depth
A liquidity mapping engine that reveals hidden zones of market vulnerability. This tool simulates where potential large concentrations of stop-losses may exist — above recent highs (sell-side) and below recent lows (buy-side) — by analyzing real price behavior and directional volume. The result is a dynamic two-sided volume profile that highlights where price is most likely to gravitate during liquidation events, reversals, or engineered stop hunts.
🔵 KEY FEATURES
Two-Sided Liquidity Profiles:
Plots two separate profiles on the chart — one above price for potential sell-side liquidity , and one below price for potential buy-side liquidity . Each profile reflects the volume distribution across binned zones derived from historical highs and lows.
Real Stop Zone Simulation:
Each profile is offset from the current high or low using an ATR-based buffer. This simulates where traders might cluster their stop-losses above swing highs (short stops) or below swing lows (long stops).
Directional Volume Analysis:
Buy-side volume is accumulated only from bullish candles (close > open), while sell-side volume is accumulated only from bearish candles (close < open). This directional filtering enhances accuracy by capturing genuine pressure zones.
Dynamic Volume Heatmap:
Each liquidity bin is rendered as a horizontal box with a color gradient based on volume intensity:
- Low activity bins are shaded lightly.
- High-volume zones appear more vividly in red (sell) or lime (buy).
- The maximum volume bin in each profile is emphasized with a brighter fill and a volume label.
Extended POC Zones:
The Point of Control (PoC) — the bin with the most volume — is extended backwards across the entire lookback period to mark critical resistance (sell-side) or support (buy-side) levels.
Total Volume Summary Labels:
At the center of each profile, a summary label displays Total Buy Liquidity and Total Sell Liquidity volume.
This metric helps assess directional imbalance — when buy liquidity is dominant, the market may favor upward continuation, and vice versa.
Customizable Profile Granularity:
You can fine-tune both Resolution (Bins) and Offset Distance to adjust how far profiles are displaced from price and how many levels are calculated within the ATR range.
🔵 HOW IT WORKS
The indicator calculates an ATR-based buffer above highs and below lows to define the top and bottom of the liquidity zones.
Using a user-defined lookback period, it scans historical candles and divides the buffered zones into bins.
Each bin checks if bullish (or bearish) candles pass through it based on price wicks and body.
Volume from valid candles is summed into the corresponding bin.
When volume exists in a bin, a horizontal box is drawn with a width scaled by relative volume strength.
The bin with the highest volume is highlighted and optionally extended backward as a zone of importance.
Total buy/sell liquidity is displayed with a summary label at the side of the profile.
🔵 USAGE/b]
Identify Stop Hunt Zones: High-volume clusters near swing highs/lows are likely liquidation zones targeted during fakeouts.
Fade or Follow Reactions: Price hitting a high-volume bin may reverse (fade opportunity) or break with strength (confirmation breakout).
Layer with Other Tools: Combine with market structure, order blocks, or trend filters to validate entries near liquidity.
Adjust Offset for Sensitivity: Use higher offset to simulate wider stop placement; use lower for tighter scalping zones.
🔵 CONCLUSION
Dynamic Liquidity Depth transforms raw price and volume into a spatial map of liquidity. By revealing areas where stop orders are likely hidden, it gives traders insight into price manipulation zones, potential reversal levels, and breakout traps. Whether you're hunting for traps or trading with the flow, this tool equips you to navigate liquidity with precision.

Smarter Money Concepts - MTF IFVGs [PhenLabs]📊 Smarter Money Concepts - MTF IFVG
Version: PineScript™ v6
📌 Description
This multi-timeframe indicator identifies Inverse Fair Value Gaps (IFVGs) and their inversions across simultaneous chart intervals, helping traders spot liquidity voids and potential reversal zones. By analyzing price action through the lens of institutional order flow patterns, it solves the problem of manual gap tracking across timeframes while incorporating volatility-adjusted parameters and psychological level analysis for higher-probability setups.
🚀 Points of Innovation
• Multi-Timeframe Engine - Simultaneous analysis of 3 higher timeframes
• Adaptive Parameters - Auto-adjusts to market volatility conditions
• Quality Scoring System - Ranks gaps using RVI strength and size metrics
• Inversion Tracking - Monitors failed gaps for counter-trend signals
• Render Optimization - Prevents chart clutter with smart gap management
🔧 Core Components
FVG Detection Logic: Identifies gaps using customizable price source (Close/Wick)
Inversion Tracker: Manages failed gaps and generates counter signals
Multi-Timeframe Engine: Processes 3 independent higher timeframe analyses
Dashboard System: Real-time display of active gaps across all timeframes
🔥 Key Features
• Volatility-adjusted gap size filters (ATR-based)
• Customizable timeframe confluence analysis
• Color-coded quality scoring
• Non-repainting inversion signals
• Mobile-optimized visual rendering
🎨 Visualization
• Colored Boxes: Translucent zones show active gaps (green/bullish, red/bearish)
• Midline Plot: Dashed gray line marks gap midpoint for price targets
• Inversion Markers: Intense colors show failed gaps (dark red/bullish failure, bright green/bearish failure)
• HTF Differentiation: Higher timeframe gaps shown in blue/teal hues
📖 Usage Guidelines
Multi-Timeframe Settings
• Higher Timeframe 1
Default: 30 | Range: Any > Chart TF | Controls primary confluence timeframe
• Show All Timeframes
Default: True | Toggles multi-TF gap displays
Gap Settings
• Source
Default: Close | Options: | Determines gap measurement method
• RVI Period
Default: 14 | Range: 1-50 | Sets momentum confirmation sensitivity
• RVI Value
Default 0.1 | 0 to see all IFVGs | Increase min RVI to see the most powerful IFVGs
✅ Best Use Cases
• Identifying confluence across timeframes
• Spotting institutional order blocks
• High-probability reversal trading
• Trend continuation confirmation
• Volatility breakout setups
⚠️ Limitations
• Repaints historical gap zones
• Requires understanding of FVG concepts
• Higher timeframe data latency
• Quality scores rely on RVI/ATR settings
💡 What Makes This Unique
First FVG indicator with true multi-timeframe processing
Adaptive parameters that auto-adjust to volatility
Quantifiable quality scoring system
Professional-grade dashboard with HTF tracking
🔬 How It Works
Gap Detection: Identifies FVGs using price relationships and RVI confirmation
Inversion Tracking: Monitors price breaches to flag failed gaps
Quality Assessment: Scores gaps based on size, momentum, and location
Adaptive Filtering: Adjusts parameters using ATR-based volatility analysis
Multi-TF Synthesis: Correlates gaps across user-selected timeframes
Visual Rendering: Displays only relevant, active gaps to prevent clutter
💡 Note:
Start with default settings and gradually adjust parameters after observing market interactions. Focus on gaps with quality scores above 7 that align with higher timeframe trends. Combine with price action at psychological levels for highest-probability setups. Remember that higher timeframe gaps generally carry more significance than current chart gaps.

US30 Smart Money 5M/4H Strategy🧠 How It Works
✅ 1. 4H Trend Bias Detection
Uses the 4-hour chart (internally) to determine if the market is in an uptrend or downtrend.
Background turns green for bullish trend, red for bearish trend.
This helps filter trades — only take longs during uptrend, shorts during downtrend.
✅ 2. Liquidity Sweeps (Stop Hunts) on 5M
Highlights candles that break previous highs/lows and then reverse (typical of institutional stop raids).
Draws a shaded red box above sweep-high candles and green box under sweep-lows.
These indicate key reversal zones.
✅ 3. Order Block Zones
Detects bullish/bearish engulfing patterns after liquidity sweeps.
Draws a supply or demand zone box extending forward.
These zones show where institutions likely placed large orders.
✅ 4. FVG Midpoint from 30-Min Chart
Detects Fair Value Gaps (imbalances) on the 30-minute chart.
Plots a line at the midpoint of the gap (EQ level), which is often revisited for entries or rejections.
✅ 5. Buy/Sell Signals (Non-Repainting)
Buy = 4H uptrend + 5M liquidity sweep low + bullish engulfing candle.
Sell = 4H downtrend + 5M liquidity sweep high + bearish engulfing.
Prints green “BUY” or red “SELL” label on the chart — these do not repaint.
📈 How to Use It
Wait for trend bias — only take trades in the direction of the 4H trend.
Watch for liquidity sweep boxes — these hint a stop hunt just occurred.
Look for a signal label (BUY/SELL) — confirms entry criteria.
Use FVG EQ lines & Order Block zones as confluence or targets.
Take trades after NY open (9:30 AM EST) for best momentum.

ICT Turtle Soup (Liquidity Reversal)ICT Turtle Soup — Liquidity Reversal Detection
Classic Liquidity Trap Reversal Strategy for Smart Money Traders
This indicator implements the ICT Turtle Soup concept — a classic liquidity-based reversal pattern — which occurs when price runs above or below a recent swing level to grab liquidity, then sharply reverses. This pattern is commonly used in Smart Money Concepts (SMC) and Inner Circle Trader (ICT) strategies to anticipate false breakouts and high-probability reversals.
🔍 What This Script Does:
Identifies Swing Highs & Lows
Detects recent swing highs and lows using a customizable lookback period.
Tracks Liquidity Grabs
A bearish Turtle Soup setup is triggered when price breaks above a recent swing high but closes back below it.
A bullish Turtle Soup setup is triggered when price breaks below a recent swing low but closes back above it.
These conditions often signal liquidity traps, where price sweeps resting orders before reversing.
Plots Signals Directly on the Chart
Turtle Soup setups are marked with 🐢🔻 (bearish) and 🐢🔺 (bullish) labels.
Optional full-text labels can also be displayed for clarity and journaling.
Includes Alert Conditions
Alerts can be enabled to notify you of bullish or bearish Turtle Soup reversals in real-time.
⚙️ Customization Features:
Adjustable swing lookback period
Enable/disable Turtle Soup labels
Set label font size
Choose your preferred bullish/bearish signal colors
💡 How to Use:
Add this script to your chart (ideally on intraday timeframes such as 5m–15m).
Wait for a Turtle Soup signal near a key swing high/low or liquidity zone.
Combine with other confirmation tools (e.g., FVGs, Order Blocks, OTE) for stronger setups.
Use alerts to stay ahead of fast-moving reversals.
🧠 Why It Works:
Turtle Soup setups are rooted in liquidity theory — they exploit the market’s tendency to sweep obvious swing levels before reversing. These moves often trap retail traders and mark the beginning of Smart Money entries.
🔗 Best Used With:
Maximize the edge by combining this with other SMC tools:
✅ First FVG — Opening Range Fair Value Gap Detector
✅ ICT SMC Liquidity Grabs + OB + Fibonacci OTE Levels
✅ Liquidity Levels — Smart Swing Lows
Together, they create a complete ecosystem for identifying, confirming, and executing liquidity-driven trade setups with precision.

Wick Sweep EntriesWick Sweep Entry designed by Finweal Finance (Indicator Originator : Prajyot Mahajan) :
This Indicator is specially designed for Nifty, Sensex and Banknifty Options Buying. This works well on Expiry Days.
Setup Timeframe : 5m and 1m.
Entry Criteria :
For Long/CE :
Wait for Sweep of 5m Candle Low with next 5m Candle but you do not wait for the next 5 minute candle to close, you enter directly whenever any 1 minute candle of next 5minute candle to close above the low of previous 5m Candle.
For Short/PE :
Wait for Sweep of 5m Candle High with next 5m Candle but you do not wait for the next 5 minute candle to close, you enter directly whenever any 1 minute candle of next 5minute candle to close below the High of previous 5m Candle.
Key notes :
1. As this is the Scalping High Frequency Strategy, it is to be used for scalping purpose only. You might have losses too so to avoid the noise in the market, i suggest you to use this strategy in the first 45 minutes to 1 hour of Indian Markets as this is a volatility Strategy.
2. Although Nifty and Banknifty are independent indices, they still show some reactions with each other, so if you spot a long entry on BNF and Short Entry on nifty then you will avoid taking the trade, you will take the trade only if there is a tandem activity or At least the other index is not showing opposite signal.
3. If target is not hit and you spot another entry, you will avoid taking the new entry.
The Indicator will automatically spot/plot the entry signal, all you need to do is enter as soon as 1minute candle closes either below prior 5 minute candle High for Short/PE or closes above 5minute low for Long/CE.
For Targets :
You Can Target recent minor pull back, FVG, or Order blocks.
Remember : This is a scalping strategy so don't hold trade for more than 4/5 1minute Candles

Volumatic Trend [ChartPrime]
A unique trend-following indicator that blends trend logic with volume visualization, offering a dynamic view of market momentum and activity. It automatically detects trend shifts and paints volume histograms at key levels, allowing traders to easily spot strength or weakness within trends.
⯁ KEY FEATURES
Trend Detection System:
Uses a custom combination of weighted EMA (swma) and regular EMA to detect trend direction.
A diamond appears on trend shift, indicating the starting point of a new bullish or bearish phase.
Volume Histogram Zones:
At each new trend, the indicator draws two horizontal zones (top and bottom) and visualizes volume activity within that trend using dynamic histogram candles.
Gradient-Based Candle Coloring:
Candle color is blended with a gradient based on volume intensity. This helps highlight where volume spikes occurred, making it easy to identify pressure points.
Volume Summary Labels:
A label at the end of each trend zone displays two critical values:
- Delta: net volume difference between bullish and bearish bars.
- Total: overall volume accumulated during the trend.
⯁ HOW TO USE
Monitor diamond markers to identify when a new trend begins.
Use volume histogram spikes to assess if the trend is supported by strong volume or lacking participation.
A high delta with strong total volume in a trend indicates institutional support.
Compare gradient strength of candles—brighter areas represent higher-volume trading activity.
Can be used alone or combined with other confirmation tools like structure breaks, liquidity sweeps, or order blocks.
⯁ CONCLUSION
Volumatic Trend gives you more than just trend direction—it provides insight into the force behind it. With volume-graded candles and real-time histogram overlays, traders can instantly assess whether a trend is backed by conviction or fading strength. A perfect tool for swing traders and intraday strategists looking to add volume context to their directional setups.

Quantum Motion Oscillator-QMO (TechnoBlooms)Quantum Motion Oscillator (QMO) is a momentum indicator designed for traders who demand precision. Combining multi-timeframe weighted linear regression with EMA crossovers, QMO offers a dynamic view of market momentum, helping traders anticipate trend shifts with greater accuracy.
This oscillator is inspired by quantum mechanics and wave theory, where market movement is seen as a series of probabilistic waves rather than rigid structures.
The histogram is plotted in proportion to the price movement of the candlesticks.
KEY FEATURES
1. Multi-Timeframe Histogram - Integrates 1 to 5 weighted linear regression averages, reducing lag while maintaining accuracy.
2. EMA Crossover Signal - Uses a Short and Long EMA to confirm trend shifts with minimal noise.
3. Adaptive Trend Analysis - Self-adjusting mechanics make QMO effective in both ranging and trending markets.
4. Scalable for Different Trading Styles - Works seamlessly for scalping, intraday, swing and position trading.
ADVANCED PROFESSIONAL INSIGHTS
1. Wave Dynamics and Market Flow - Inspired by wave mechanics, QMO reflects the energy accumulation and dissipation in price movements.
Expanding histogram waves = Strong momentum surge
Contracting waves = Momentum weakening, potential reversal zone.
2. Liquidity and Order Flow Applications - QMO works well alongside liquidity concepts and smart money techniques:
Combine with Fair Value Gaps & Order Blocks -> Enter when QMO signals align with liquidity zones.
Avoid False Moves - If price sweeps liquidity, but QMO momentum diverges, it is a sign of potential smart money manipulation.

cd_mtg_CxThis indicator is designed to show discount / premium zones and price gaps (fvg) on the screen within a rule.
Overview:
As it is known, the price continues its movement with swings and uses some zones to continue or reverse its movement. Commonly used of these zones are named by different traders such as supply / demand, order block, suport/ resistance zone. And again, many traders prefer to be involved in the entry when the price determined with the help of market structure reaches the premium / discount zones.
Expectation from the indicator and how it works:
Identify areas where the price is likely to react.
Zones to be determined for this purpose:
1- Discount / premium zones
2- Mitigation zones with price retesting
3- Price gaps (FVG's)
How is it determined?
1- Tracks the price in the higher timeframe it is alignment with, when the price violates the previous candle in the new candle (high/low), the previous candle's zones between top/bottom - middle levels.
high - middle => premium zone
low - middle => discount zone
and displays it on the screen.
2- Mitigation zones: When the price retests the discount/premium zones, those zones appear on the screen by extending to the last bar and are named as mitigation zones in the indicator.
3- Price gaps (FVG's): It is shown on the screen with known rules and higher time frame option.
Zones where the price does not respect are deleted from the display.
Settings:
- HTF for mitigation zones : Alignment high time frame selection
- HTF for FVG zones : Alignment high time frame selection
- Show HTF boxes : Show / hide
- Show Mitigation zones : Show / hide
- Show Discount/Premium zones: Show / hide
- Show FVG zones : Show / hide
And colors….
Screenshots and example :
The 15m chart is open on the screen and I select the alignment time zone H4. I select the higher time zone H1 in FVGs.
Screenshot with Show HTF boxes and Show FVG zones selected:
With show discount / premium zones selected :
With show mitigation zones selected :
Final Word : When the price comes to our zone, we take action together with other confirmations.
Our expectation from the zones is to send the price back to the region it came from.
If it is not successful, we should plan a reverse transaction.
Cheerful trades...
-- Türkçe Açıklama
Bu indikatör, bir kural dahilinde ucuzluk / pahalılık bölgelerini ve fiyat boşluklarını (fvg) ekranda göstermek ve traderlara en uygun yerde işlem fırsatı sunmak üzere tasarlanmıştır.
Genel Bakış :
Bilindiği gibi fiyat hareketine salınımlarla devam eder ve hareketine devam etmek ya da tersine dönmek için bazı bölgeleri kullanır. Bu bölgelerin yaygın şekilde kullanılanları supply / demand, order block , support /resistance zone gibi farklı ekollerce adlandırılmıştır. Ve yine birçok trader market yapısı yardımla belirlediği fiyatın ucuzluk / pahalılık bölgelerine gelmesiyle işleme dahil olmayı tercih eder.
İndikatörden beklenti ve nasıl çalışır:
Beklenti; Fiyatın tepki alması muhtemel bölgeleri belirlemesidir.
Bu amaçla belirleyeceği bölgeler:
1- Ucuzluk / pahalılık bölgeleri
2- Fiyatın tekrar test etmesiyle “mitigasyon bölgeleri/mitige”
3- Fiyat boşlukları (FVG ler)
Nasıl belirler ?
1- Fiyatı uyumlu olduğu üst zaman diliminde takip eder, fiyat yeni mumda bir önceki mumu ihlal ettiğinde (high/low), önceki mumun tepe/dip - orta seviyeleri arasında kalan bölgeleri
high - middle => premium zone
low - middle => discount zone
olarak belirler ve ekranda gösterir.
2- Mitigasyon bölgesi: Fiyat ucuzluk/ pahalılık bölgeleri yeniden test ettiğinde, o bölgeler son bara uzatılarak ekranda görünür ve indikatörde ismi “mitigation zone” olarak geçer.
3- Fiyat boşlukları (FVG) : Bilinen kurallarla ve üst zaman dilimi seçeneğiyle ekranda gösterilir.
Fiyatın saygı göstermediği bölgeler ekrandan silinir.
Ayarlar:
- HTF for mitigation zones : Uyumlu üst zaman dilimi seçimi
- HTF for FVG zones : Uyumlu üst zaman dilimi seçimi
Gösterim ve renk seçenekleri.
Ekran görüntüleri ve örnek : (İngilizce kısımda)
Son söz : Fiyat bölgemize geldiğinde diğer konfirmelerle birlikte işlem alıyoruz.
Bölgelerden beklentimiz fiyatı geldiği bölgeye tekrar göndermesidir.
Eğer başarılı olamazsa tersi yönde işlem planlamalıyız.
Neşeli tradeler...
